Chiffres clés
Indicateurs financiers
| En million d’euros | 2023 | 2022 | Variation (%) | |
|---|---|---|---|---|
| Publiée | A périmètre et taux de change constants | |||
| Chiffre d’affaires consolidé | 3 937 | 3 642 | + 8,2% | +19,6% |
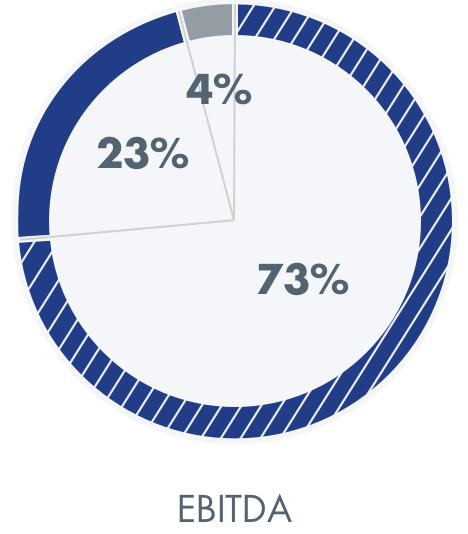
| EBITDA | 740 | 570 | + 29,8% | +41,0% |
| Taux de marge (en %) | 18,8 | 15,7 | ||
| EBIT | 433 | 284 | +52,1% | +68,0% |
| Taux de marge (en %) | 11 | 7,8 | ||
| Résultat net consolidé | 295 | 175 | +68,3% | +88,1% |
| Taux de marge (en %) | 7,5 | 4,8 | ||
| Résultat net part du Groupe | 258 | 156 | +65,6% | +84,8% |
| Capacité d'autofinancement | 589 | 461 | +27,7% | +35,5% |
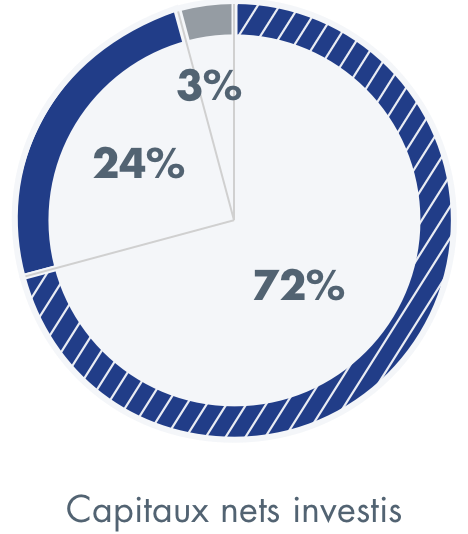
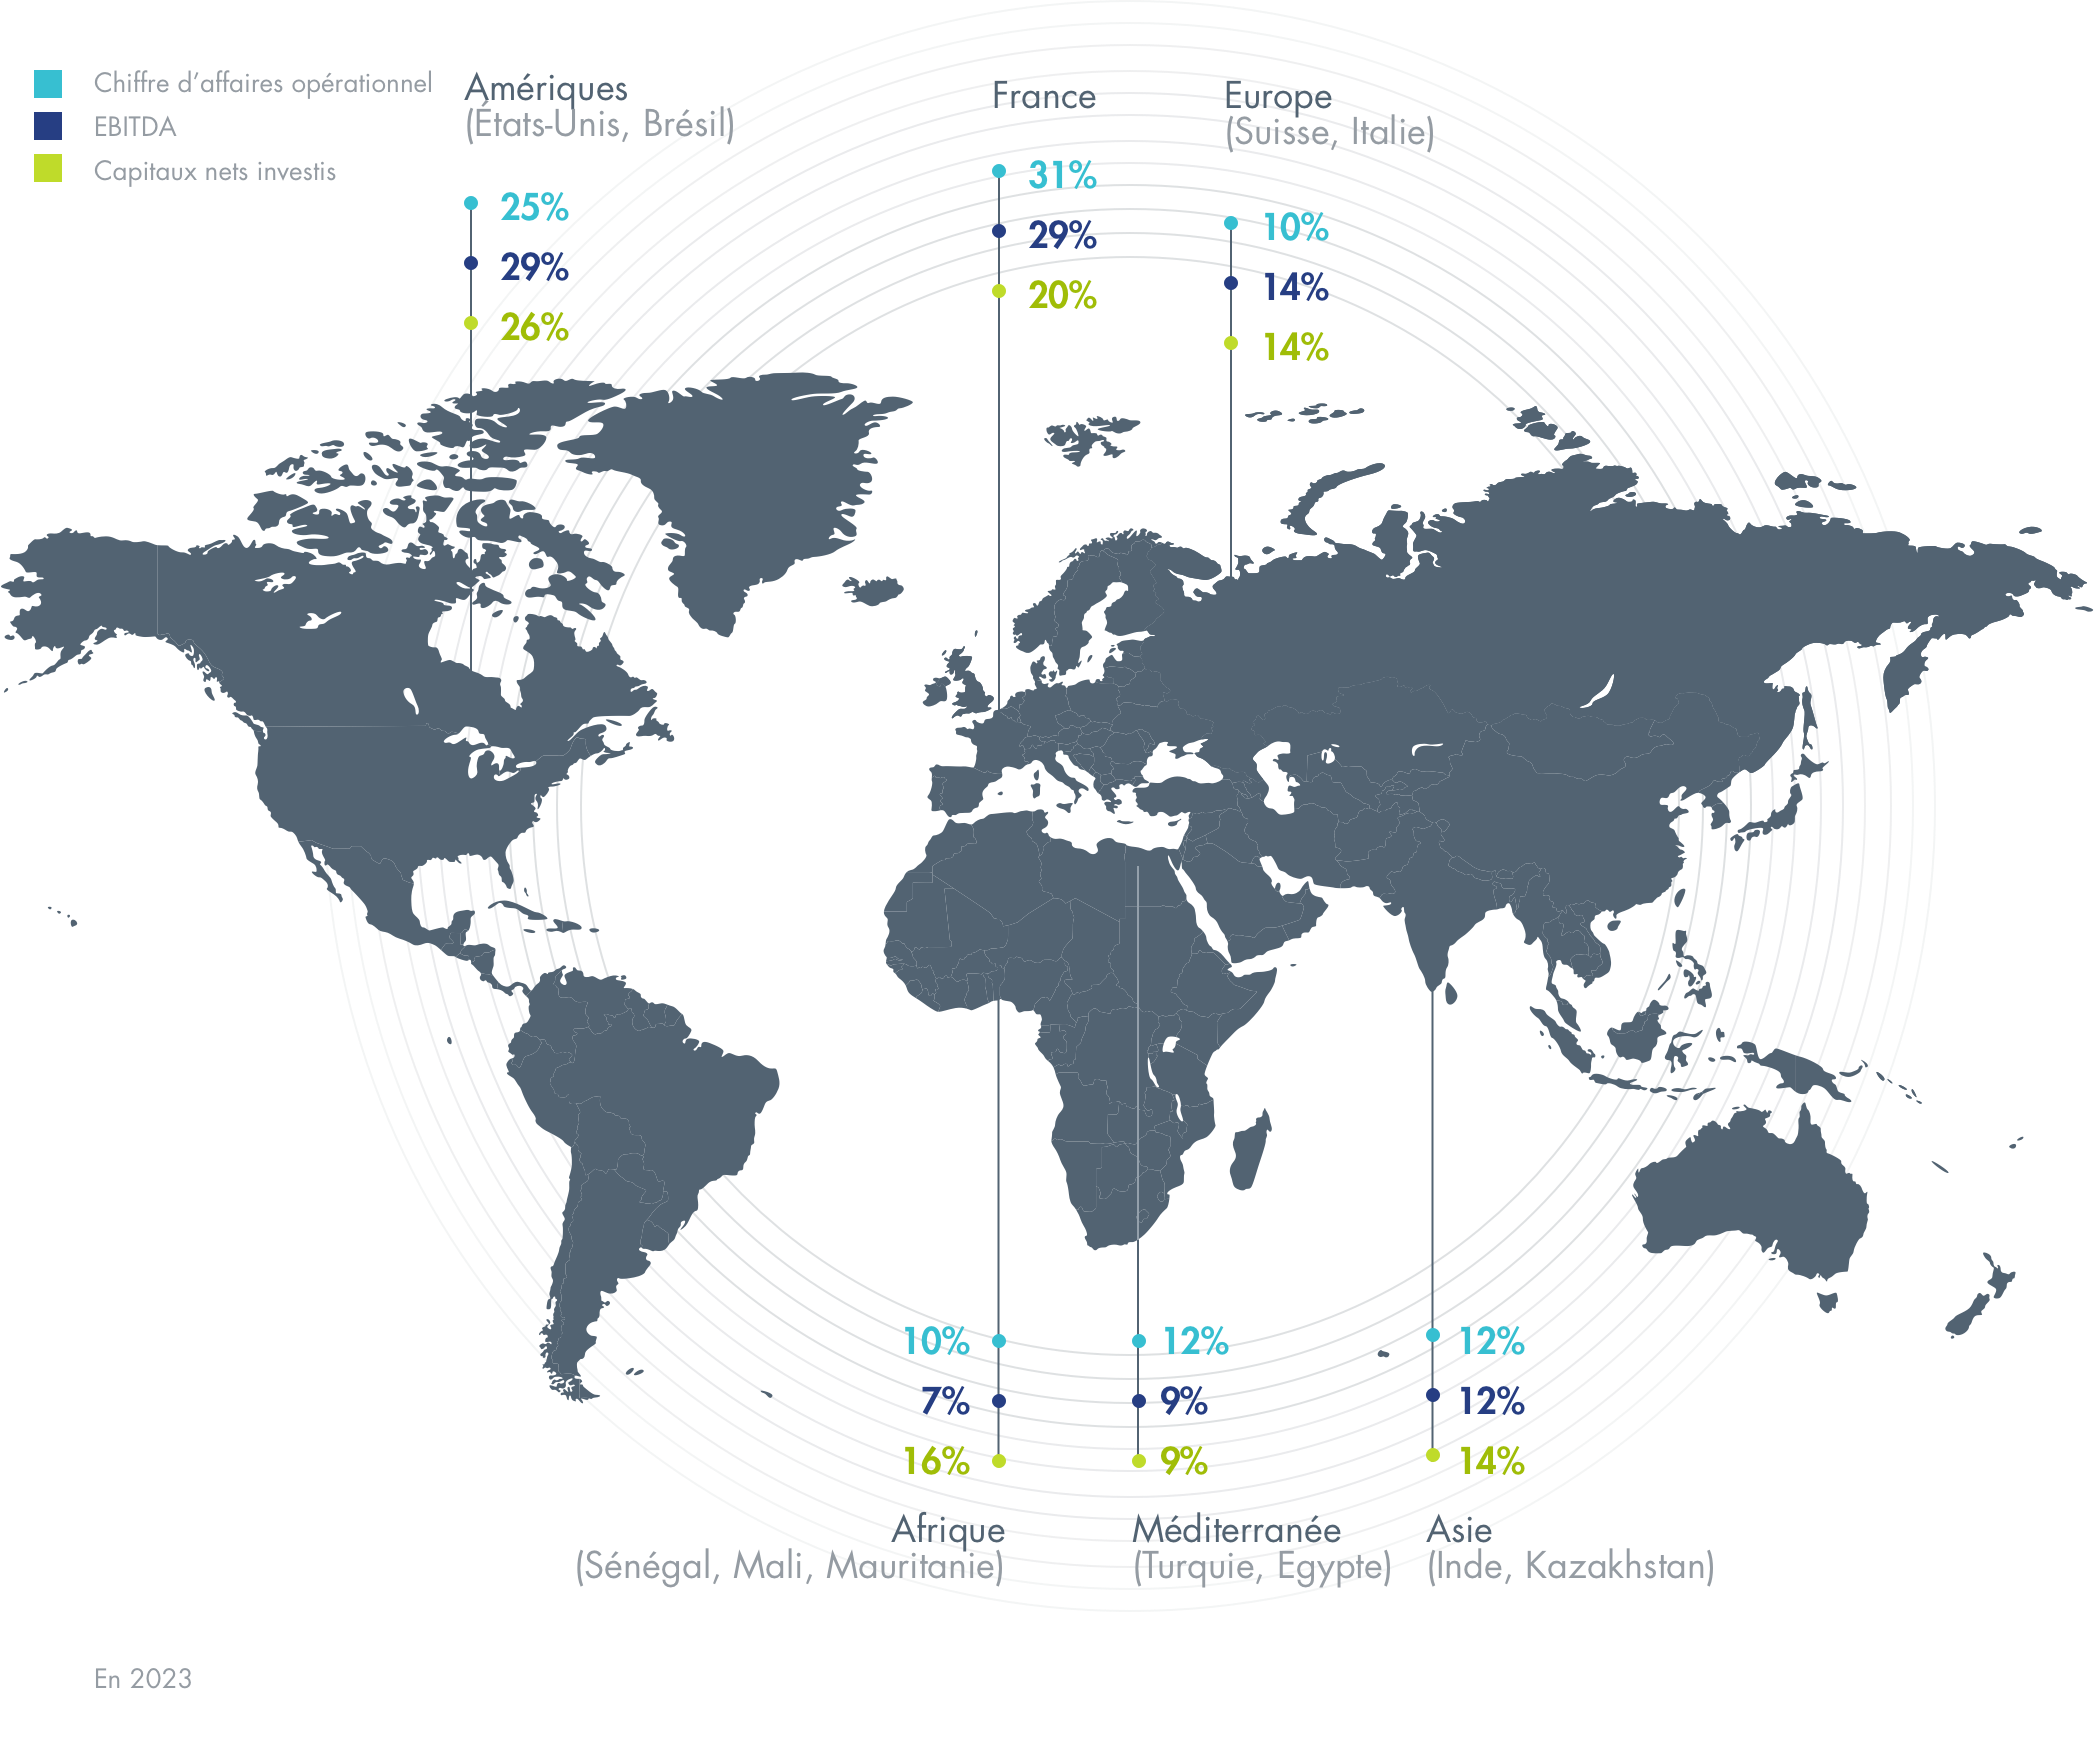
Répartition par zone géographique
Répartition par activité en 2023